
Today’s Post by Joe Farace
“The whole point of taking pictures is so that you don’t have to explain things with words.” ―
When I’m teaching a workshop or seminar, no matter what the ostensible subject may be, the topic of exposure almost always comes up. Ultimately my answer comes down to talking about latitude:
Exposure latitude is a measurement of how much an image created with either film or a digital imaging sensor can be overexposed or underexposed and still produce an acceptable result.
At The SEMA Show
These days not every photographer started out making images with film cameras but any understanding of how to obtain proper exposure can be helped with just a little bit of information about how film capture worked and still works today.
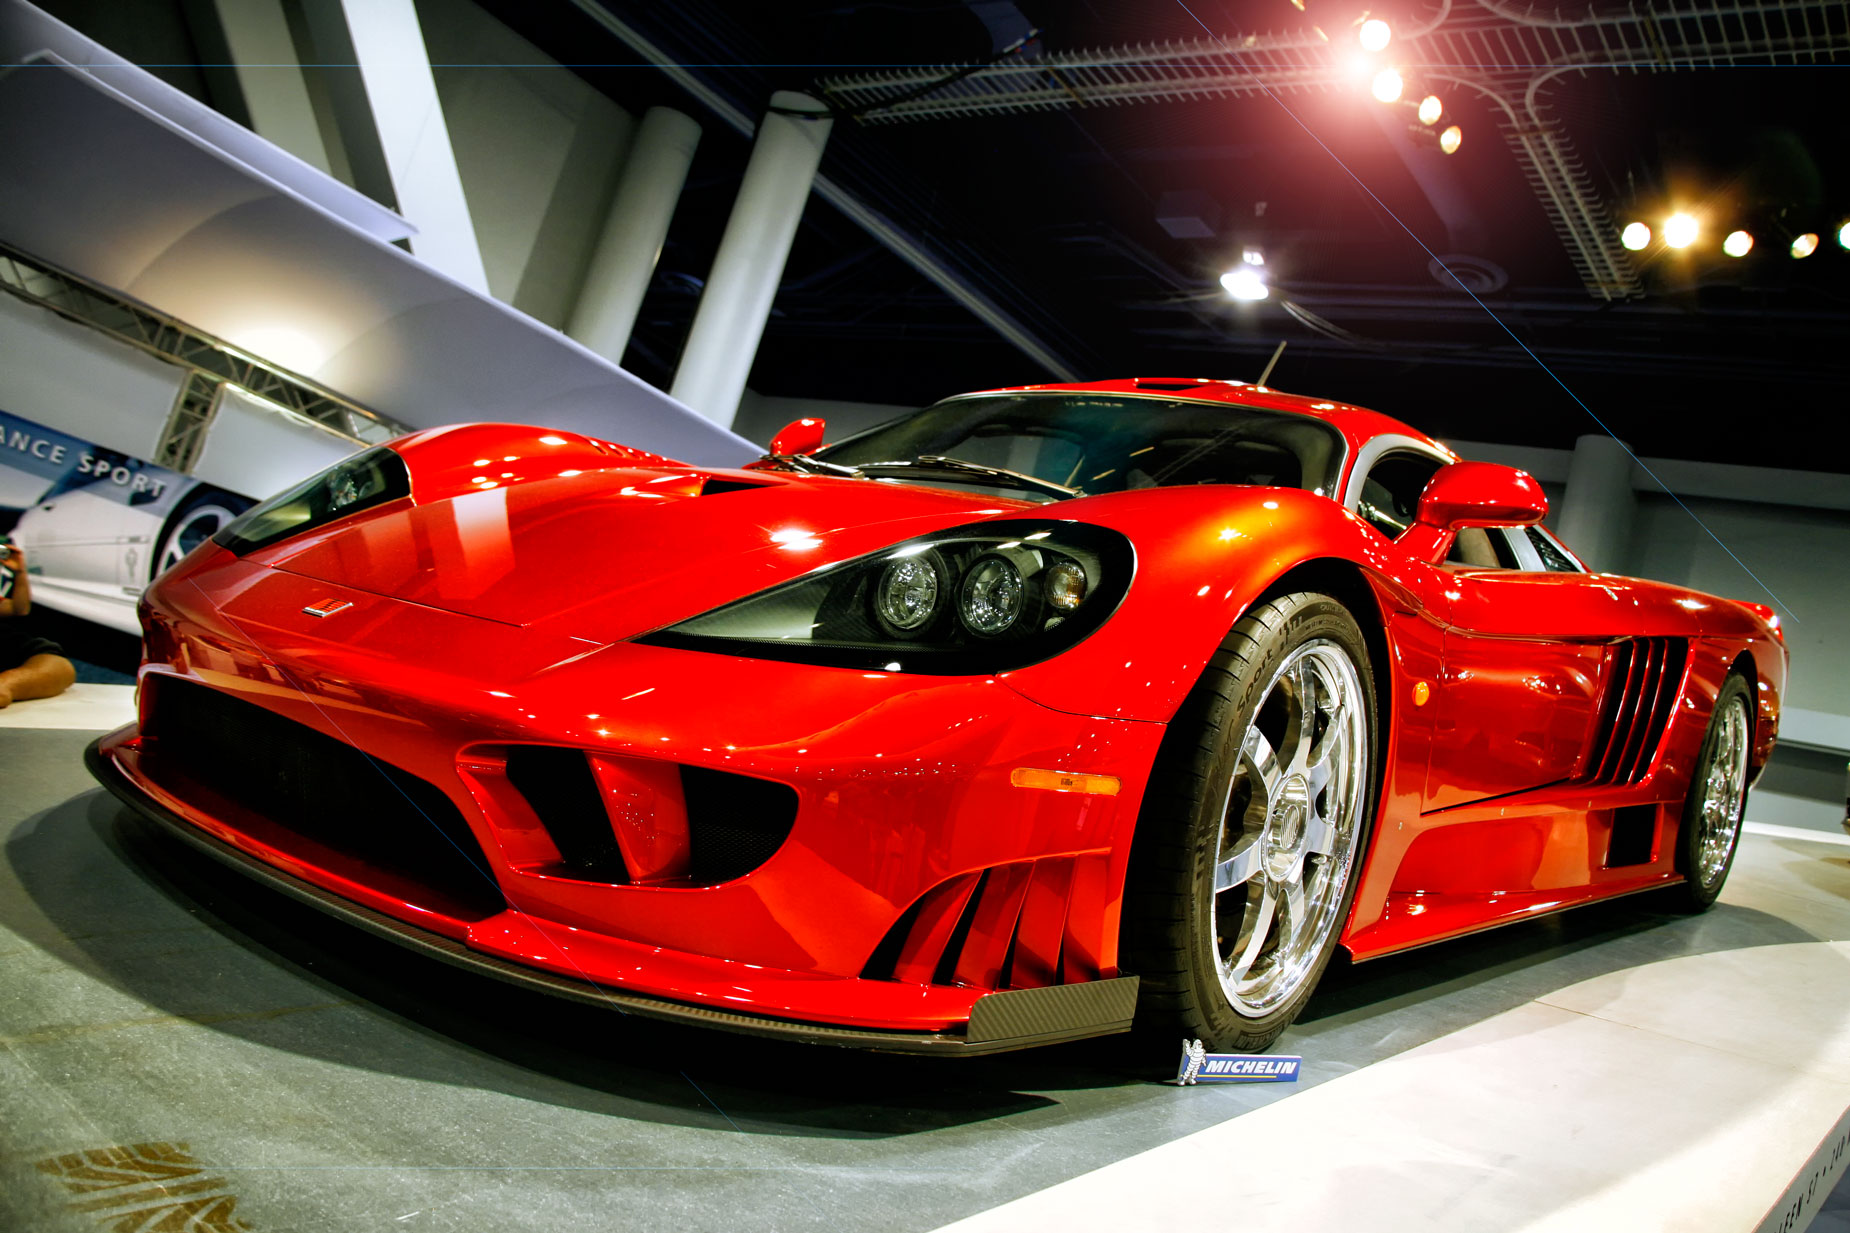
How I Made This Shot: This image of this Saleen S7 was captured at a previous SEMA show in Las Vegas. The camera used was a Canon EOS 5D Mark I with EF28-135mm f/3.5-5.6 IS USM lens at 28mm. The exposure was 1/100 sec at f/5.6 and Auto ISO mode that ending up as ISO 800. I used to be opposed to using a camera’ Auto ISO function but time and experience changed my mind. You can read about my thought process here.
Here’s the scoop on film: Slide film has the least amount of latitude, especially on the overexposure side and it’s about one to two stops depending on the specific film emulsion, not that there’s many transparency film stocks available today . Color negative aka print film, on the other hand,has two to three stops of underexposure and up to three to four and maybe more stops of overexposure, giving it a total usable range of roughly five to seven stops.
The imaging sensor in your DSLR or mirrorless camera seems to respond to exposure much like a hybrid of these two different kinds of color film: Any overexposure wipes out a lot, maybe all, of the image data but underexposure has more latitude, almost as much so as film. The downside of underexposure is the inevitable creation of noise, especially in the shadow areas.
So what’s the correct exposure?
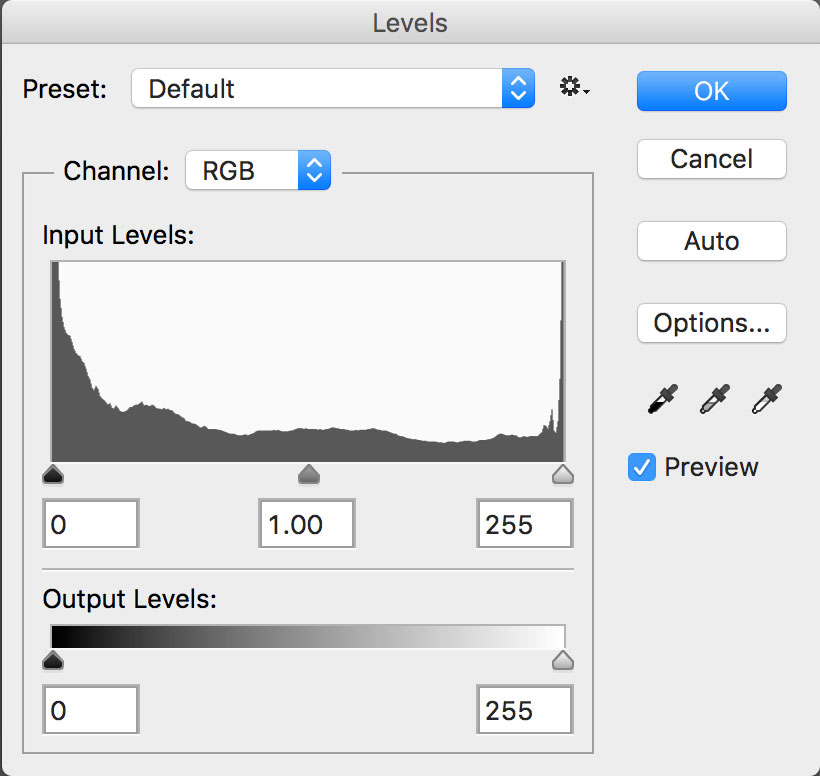 I believe only you are the ultimate arbiter of what is “correct.” One way and certainly not the only way to evaluate a particular image’s exposure is by using your camera’s histogram function. Check your User’s Guide for how to display a histogram on the camera’s LCD. Some cameras even let you display it in real time before capture. You can see the actual histogram for the above image at right.
Histograms are displayed as a graph showing a photograph’s range of brightness from highlight to shadow with light in 256 steps. Zero is on the left size of the graph and represents pure black; 255 is on the far right-hand side and represents pure white or the famous shot of a “Polar Bear in a Snowstorm.” In the middle are the mid-range values representing grays, as well as browns and greens.
On an average photograph, all of a image’s tones will be captured and the graph will rise from the bottom left corner then descends towards the bottom right producing what statisticians call a bell-shaped aka Gaussian curve because it’s shaped like a bell. If the histogram’s curves starts out too far in from either side or the slope appears cut off, then some data may be missing or the image’s contrast range may exceed the camera’s capabilities to capture what you see with your eyes.
While the classic histogram features a bell-shaped curve, not every photograph fits this type of distribution. Dramatic images with lots of light or dark tones often have really lopsided histograms but that doesn’t mean they aren’t good photographs.

Along with photographer Barry Staver, Joe is co-author of Better Available Light Digital Photography that’s available from Amazon with new copies available for $24.50, as I write this.