Today’s Post by Joe Farace
Mr. Bentley – He builds fast trucks.—Ettore Bugatti
 In a post I wrote about digital infrared photography I talked about the importance of obtaining proper exposure but as significant as this is may be for IR, it’s really critical for every photograph you make. That’s because proper exposure is a perfect storm of shutter speed, aperture and ISO to produce a pleasing result.
Ultimately It’s Your Decision
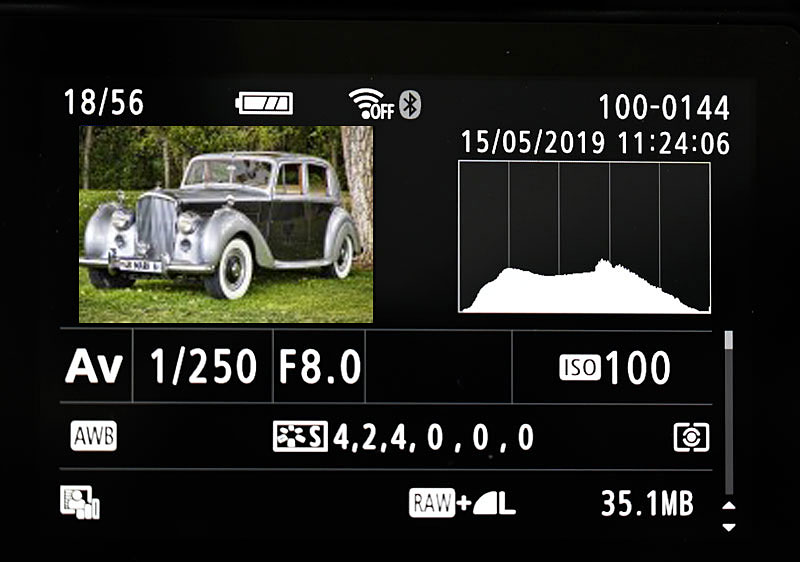
Pleasing to whom, you might ask? I strongly believe that only you are the final arbiter of what is “correct” exposure but one way to objectively evaluate a particular image’s exposure is to use your camera’s histogram function.
A histogram is a graph that shows an image’s range of light values in 256 steps. Zero is on the left side of the chart and represents pure black; 255 is on the right-hand side and represents pure white or the famous “Polar Bear in a Snowstorm” photo. In the middle are the mid-range values that represent grays, browns, and greens.
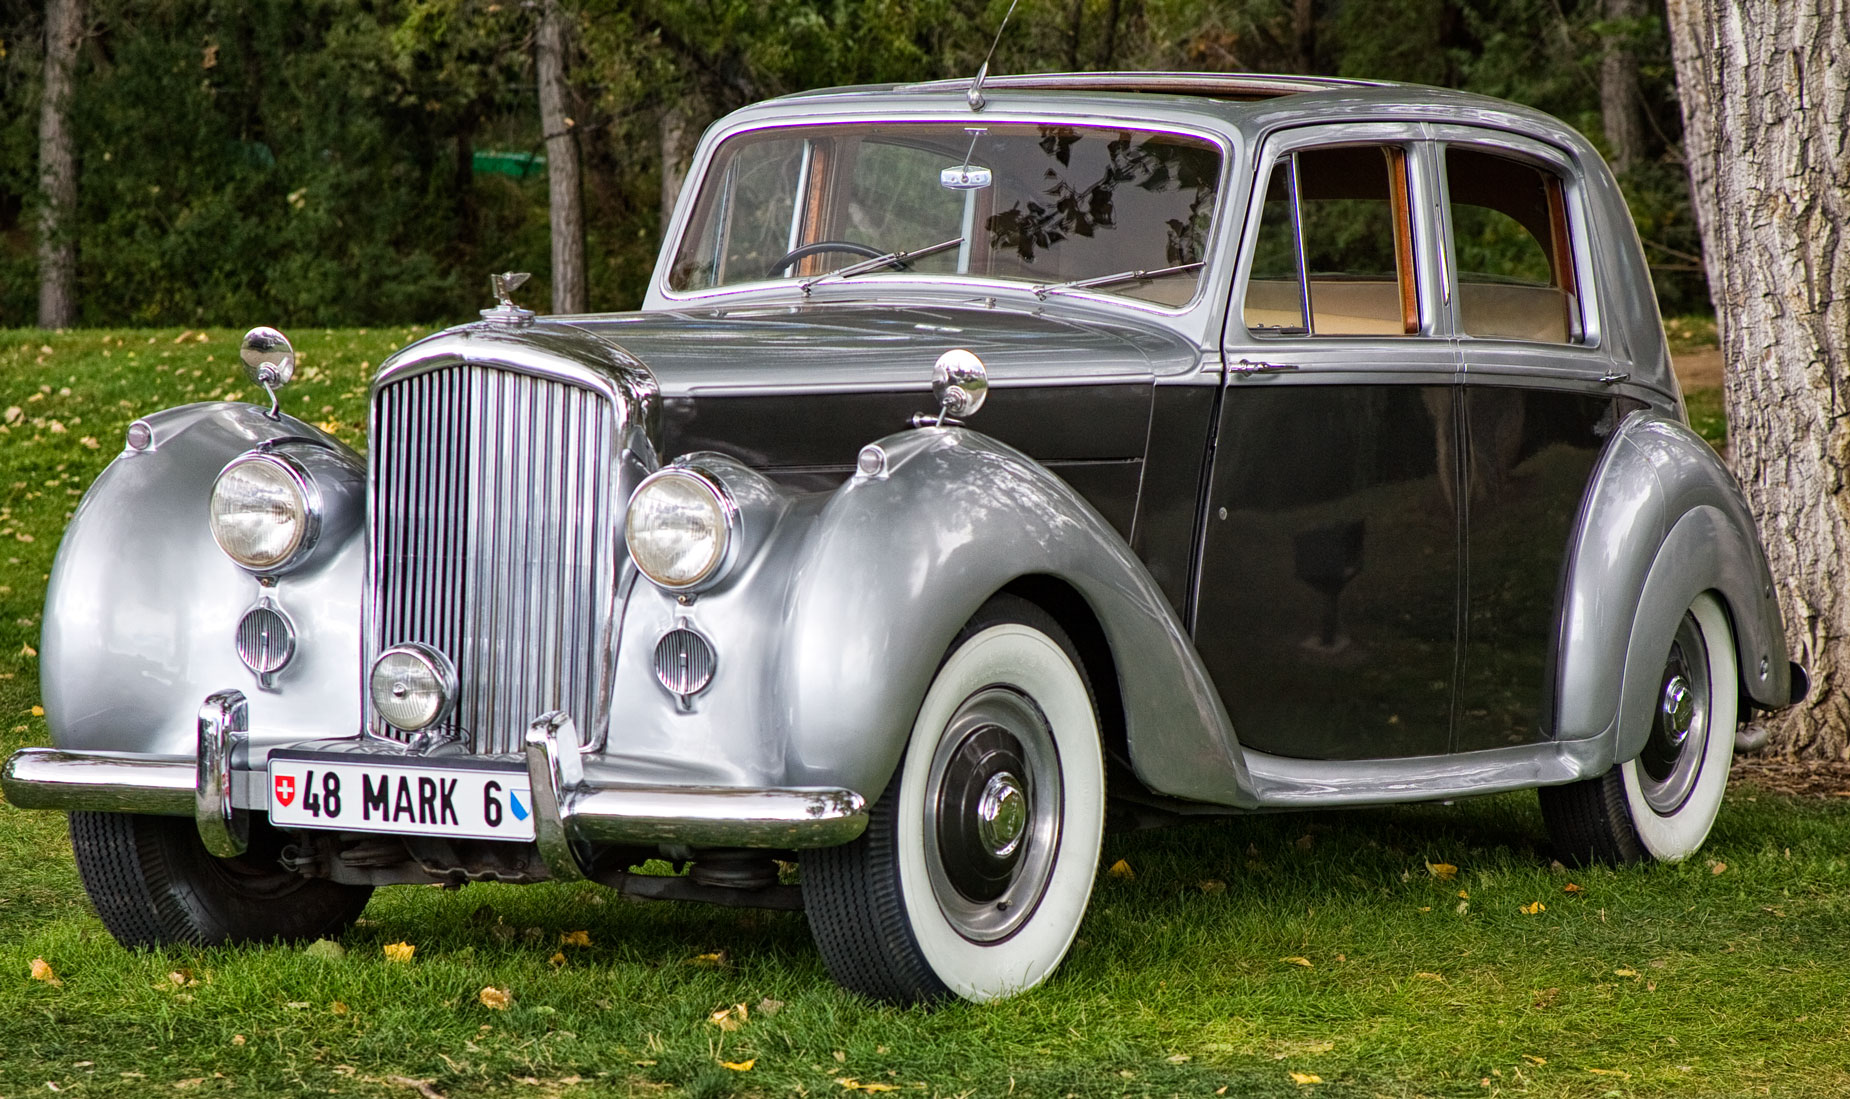
 How I made this photo: I photographed this classic Bentley using an Automobile Quarterly-style, at least I like to think so. It was made with a Canon EOS-1D Mark II N and EF 28-105mm f/3.5-4.5 II USM lens and an exposure of 1/160 sec at f/7.1 and ISO 200. You can pick up the useful EF 28-105mm f/3.5-4.5 II USM lens on Amazon for around $400, as I write this.
On a typical photograph, the histogram shows that all of the tones that are captured when the graph rises from the bottom left corner, reaches a peak in the middle, then descends towards the bottom right creating a “bell-shaped” curve because it’s, well, shaped like a bell. If the histogram’s curves starts out too far in from either side or the slope appears cut off, then exposure data can be missing and the image’s contrast range may exceed the camera’s imaging capabilities or the exposure that was chosen by you or the camera for that specific image may not be “correct” creating an underexposed or over exposed condition. But…
While the classic histogram features a bell-shaped aka Gaussian curve, not every photograph you make will fit this type of distribution. Dramatic images with lots of light or dark tones areas often have lopsided histograms but that doesn’t mean they aren’t correctly exposed for that subject matter.
If you enjoyed today’s blog post and would like to treat Joe to a cup of Earl Grey tea ($2.50), click here. And if you do, many thanks.